
Clipping a Netcdf File with Rioxarray, Problems with Sizing

I Have Been Trying to Clip a Global Precipitation Netcdf File Using a Shape File of a Basin I Have. This Is the Code: Import Geopandas as Gpd Import Rioxarray...
I have been trying to clip a global precipitation NetCDF file using a shape file of a basin I have. This is the code:
import geopandas as gpd
import rioxarray
import xarray as xr
import matplotlib.pyplot as plt
from shapely.geometry import mapping

# Load shapefile
shapefile_path = "my_shapefile.shp"
shapefile = gpd.read_file(shapefile_path, crs="epsg:4326")

# Load NetCDF file
netcdf_path = "my_netcdffile.nc"
ds = xr.open_dataset(netcdf_path)

pre = ds["pre"] # selecting precipitation

# clipping
pre.rio.set_spatial_dims(x_dim="lon", y_dim="lat", inplace=True)
pre.rio.write_crs("epsg:4326", inplace=True)
clipped_nc = pre.rio.clip(
    shapefile.geometry.apply(mapping), pre.rio.crs, drop=False
)

clipped_nc.to_netcdf("clipped_netcdf.nc") # saving nc file
I also plot the first time step and these are the code and plot:
plt.figure(figsize=(10, 6))
clipped_nc["pre"].isel(time=0).plot()
plt.savefig("plot.png")
If I zoom in, then it looks like this:
And this is the original shape file I used:
Here is my question: Does anyone know how can I reduce the size of the resulting clipped_netcdf.nc so that instead of the original size of the global precipitation NetCDF file, I get a NetCDF file of the region where the basin is located?
1 Answer
I found myself one solution, but I am open to more options.
Update: A better approach that just removes an argument and saves some code lines.
Here is the code after a question raised by @pasnik and based on the documentation here:
import geopandas as gpd
import rioxarray
import xarray as xr
import matplotlib.pyplot as plt
from shapely.geometry import mapping

# Load shapefile
shapefile_path = "my_shapefile.shp"
shapefile = gpd.read_file(shapefile_path, crs="epsg:4326")

# Load NetCDF file
netcdf_path = "my_netcdffile.nc"
ds = xr.open_dataset(netcdf_path)

pre = ds["pre"] # selecting precipitation

# ----------- code removed after pasnik comment
# Define the bounding box of the basin using the shapefile's bounds
# min_lon, min_lat, max_lon, max_lat = shapefile.total_bounds

# Subset the original dataset to the bounding box of the basin
# pre = pre.sel(
#     lat=slice(max_lat, min_lat),
#     lon=slice(min_lon, max_lon)
# )
# ------------ end code removed

# clipping
pre.rio.set_spatial_dims(x_dim="lon", y_dim="lat", inplace=True)
pre.rio.write_crs("epsg:4326", inplace=True)
clipped_nc = pre.rio.clip(
    shapefile.geometry.apply(mapping), pre.rio.crs # , drop=False drop removed as it is True by default.
)

clipped_nc.to_netcdf("clipped_netcdf.nc") # saving nc file
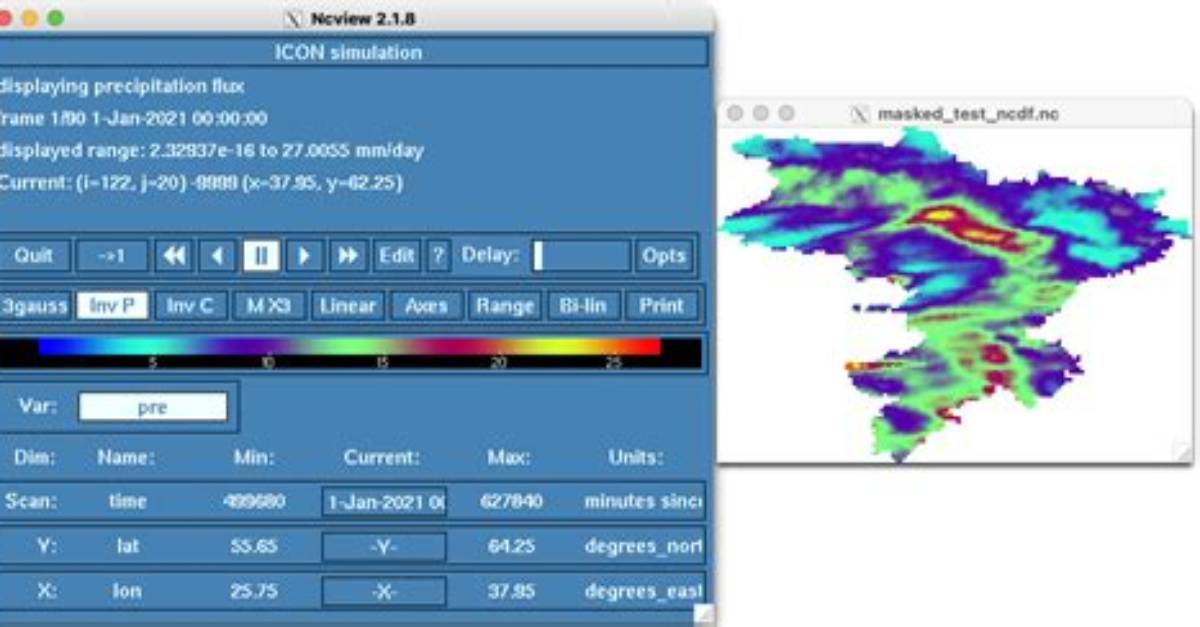
Here the resulting NetCDF file using ncview:
Robert Thorne covers electric vehicle innovations, autonomous driving systems, global mobility trends, and automotive engineering developments.
