
Descending Triangle Pattern: Trading the Breakdown

Technical Analysis Is an Essential Component of Successful Trading, Allowing Traders to Identify and Exploit Key Chart Patterns to Make Informed Decisions. One...
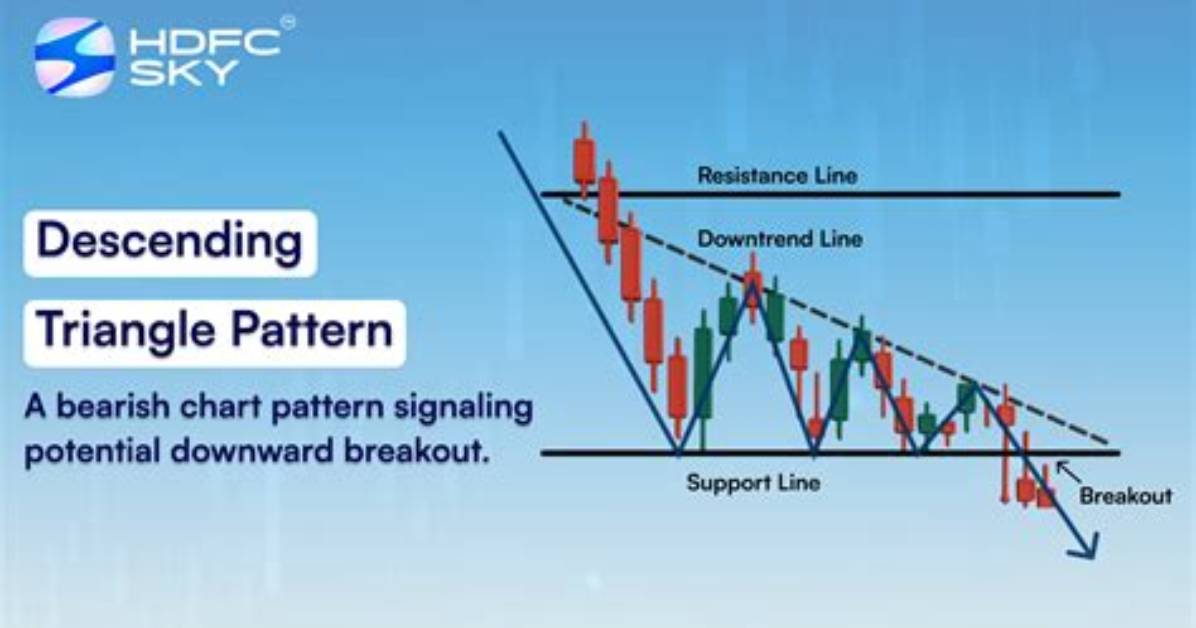
Technical analysis is an essential component of successful trading, allowing traders to identify and exploit key chart patterns to make informed decisions. One such pattern, known as the descending triangle, offers valuable insights into potential price movements.
In this article, we’ll explore the intricacies of the descending triangle pattern and its significance as a trader. To visualize the concepts discussed in this article, consider using TradingView, a popular charting platform that offers powerful tools for traders.
TradingView will allow you to draw lines on your chart when you spot a pattern.
What is the Descending Triangle Formation
The descending triangle pattern is characterized by:
- A horizontal trend line connecting a series of price lows
- A descending trend line connecting lower highs
This formation signals a potential bearish continuation, often indicating a weakening of buying pressure. The convergence of these two trend lines creates the triangular shape for which the pattern is named.
Key Features and Psychological Implications
Understanding the psychology behind the descending triangle pattern is critical to recognizing its implications. Key features include:
- An established downtrend prior to the pattern’s appearance
- A descending upper trend line indicating increased selling pressure
- A horizontal lower trend line serving as a support level
As the price repeatedly tests the support level without breaking through, traders may become increasingly bearish, leading to a high-volume breakdown below the support.
Marcus Vance is a cybersecurity auditor and technology writer dedicated to educating the public about online safety, data privacy regulations, enterprise security, and emerging cyber threats.
