
How to Get Candlesticks on Tradingview: a Comprehensive Guide

Candlestick Patterns Are Powerful Tools for Traders and Investors Looking to Analyze Price Movements and Make Informed Trading Decisions. However, There Are...
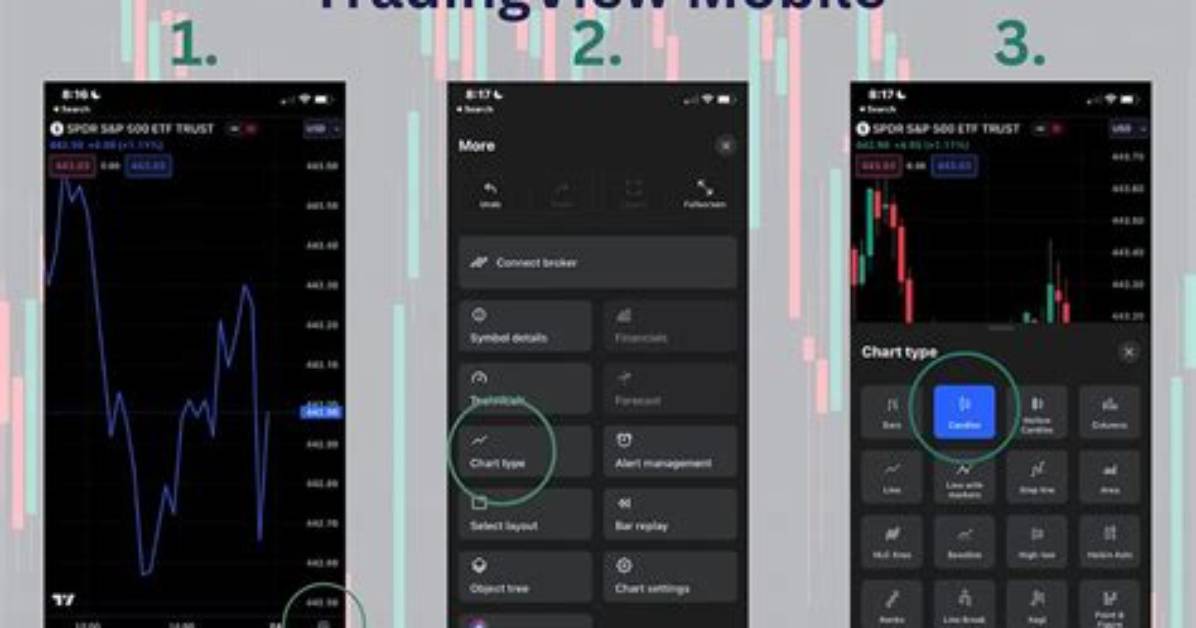
Candlestick patterns are powerful tools for traders and investors looking to analyze price movements and make informed trading decisions. However, there are times when you may find that candlesticks have disappeared from your TradingView chart.
In this article, we’ll explore what candlestick patterns are, how to get them on TradingView, and how to unhide them if they’ve accidentally been hidden. Let’s dive in!
What to Do If Candlesticks Disappear from Your Chart
If you find that candlesticks are missing from your TradingView chart, don’t worry! The most likely reason is that you’ve accidentally hidden the data series, making the candlesticks invisible.
To unhide the candlesticks and make them visible again, simply click on the little eye icon next to the symbol’s name on your chart. This will restore the visibility of the candlesticks and allow you to continue analyzing price movements.
Must Read
How to Switch to Candlestick Charts on TradingView
- Click the icon on the right side of the timeframe button at the top left
- Click candles from the dropdown menu
If your current chart is a line or something other than candlesticks, you can click the icon on the right side of the timeframe button on the top left of the chart.
From here, a dropdown menu will appear, and you can click candles.
Alexander Ross has covered the video game industry for a decade, writing deep dives on game design, esports tournaments, VR developments, and gaming culture.
