
Inverted Hammer Candlestick: Decoding a Bullish Reversal Pattern

An Intriguing Pattern in Technical Analysis the World of Technical Analysis Is Replete with Fascinating Candlestick Patterns That Traders and Investors Use to...
An Intriguing Pattern in Technical Analysis
The world of technical analysis is replete with fascinating candlestick patterns that traders and investors use to navigate the financial markets. Among these patterns, the inverted hammer stands out as a potential harbinger of a bullish trend reversal.
This article will explore the inverted hammer pattern, its interpretation, and its significance in trading strategies. TradingView offers a powerful charting platform for those keen on technical analysis, complete with a $30 discount and a 30-day free trial when you use my link.
Must Read
Decoding the Inverted Hammer
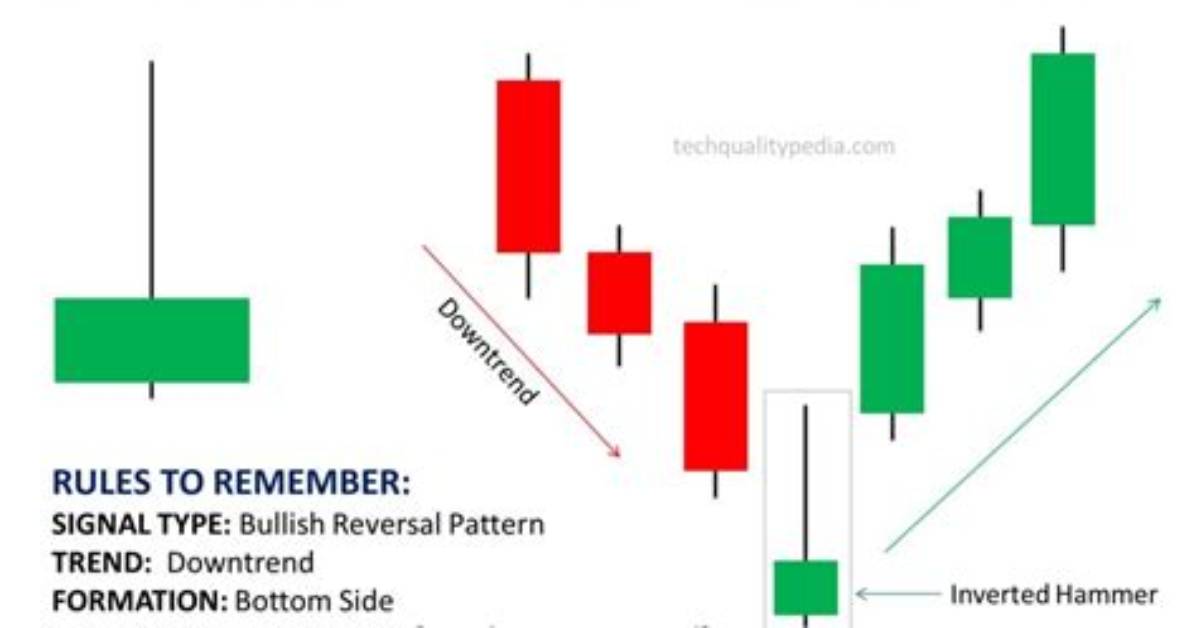
The inverted hammer is a single candlestick pattern that typically appears at the bottom of a downtrend. The key characteristics of this pattern include:
- Open, low, and close prices that are approximately the same
- A long upper shadow/wick, at least twice the length of the real body
- A small lower body, which can be either red or green. Even a red hammer candlestick signals a bullish reversal.
This pattern tells a compelling story about the struggle between buyers and sellers in the market.
David Miller brings 15 years of experience in global economics, personal finance strategy, and market dynamics. He specializes in turning complex economic trends into actionable insights for everyday readers.
