
My Jests Tests Are Leaking Memory, How Can I Fix This?

When I Run My Jest Tests, the Amount of Memory Used per Test Increases over Time. the Issue Wasn't Apparent on My Local Machine; Instead, I Found This out When...
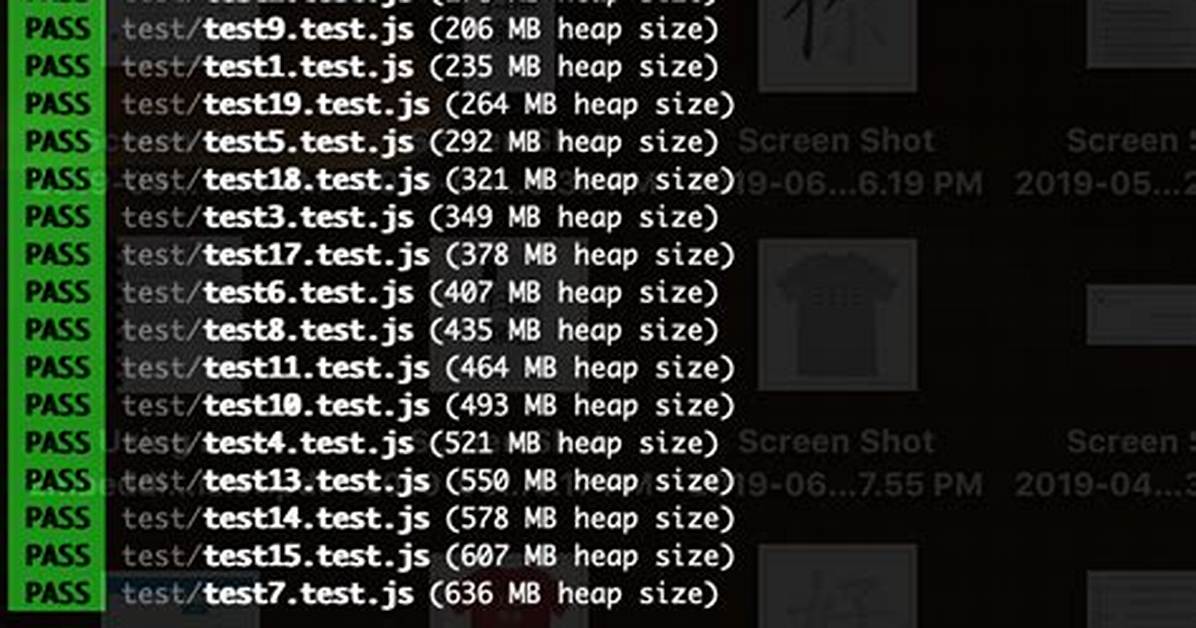
When I run my jest tests, the amount of memory used per test increases over time. The issue wasn't apparent on my local machine; instead, I found this out when running my tests on CircleCI. I got the following error:
 FAIL  __tests__/pages/login.test.tsx

  ● Test suite failed to run

    jest: failed to cache transform results in: /tmp/jest_2ne/jest-transform-cache-7bdebd1a0c578519274d14a78b89f87c-f8238a99880aac6151736010e575fab1/0b/symbols_0bf4cffb45cb261625f2f3fca21a4789.map

    Failure message: ENOMEM: not enough memory, write

      at writeFileSync (node_modules/write-file-atomic/index.js:215:10)
      at writeCacheFile (node_modules/@jest/transform/build/ScriptTransformer.js:809:33)
      at ScriptTransformer.transformSource (node_modules/@jest/transform/build/ScriptTransformer.js:554:7)
      at ScriptTransformer._transformAndBuildScript (node_modules/@jest/transform/build/ScriptTransformer.js:586:40)
      at ScriptTransformer.transform (node_modules/@jest/transform/build/ScriptTransformer.js:624:25)
How can I fix my jest configuration to prevent this?
2 Answers
First of all, make sure that you have leaky tests by running jest with the option:
jest --logHeapUsage
Run your tests and check that the memory consumption is increasing over time, like this (file names changed):
PASS  __tests__/pages/file.test.tsx (181 MB heap size)
 PASS  __tests__/pages/file2.test.tsx (193 MB heap size)
 PASS  __tests__/components/Header/file3.test.tsx (201 MB heap size)
 PASS  __tests__/components/Header/file4.test.tsx (192 MB heap size)
 PASS  __tests__/components/Header/file5.test.tsx (218 MB heap size)
 PASS  __tests__/pages/file6.test.tsx (201 MB heap size)
 PASS  __tests__/components/file6.test.tsx (203 MB heap size)
 PASS  __tests__/components/file7.test.tsx (213 MB heap size)
 PASS  __tests__/components/file8.test.tsx (234 MB heap size)
 PASS  __tests__/components/file9.test.tsx (222 MB heap size)
 PASS  __tests__/components/file10.test.tsx (240 MB heap size)
 PASS  __tests__/components/file11.test.tsx (231 MB heap size)
 PASS  __tests__/utils/file12.test.tsx (239 MB heap size)
 PASS  __tests__/components/file13.test.tsx (251 MB heap size)
 PASS  __tests__/components/file14.test.tsx (239 MB heap size)
 PASS  __tests__/components/file15.test.tsx (249 MB heap size)
 PASS  __tests__/components/file16.test.tsx (143 MB heap size)
To fix this, change your npm run test or yarn test command in your package.json to:
node --expose-gc ./node_modules/.bin/jest --runInBand --logHeapUsage
Run the command. Here's my output:
 PASS  __tests__/components/file.test.tsx (143 MB heap size)
 PASS  __tests__/pages/onboarding/file1.test.tsx (149 MB heap size)
 PASS  __tests__/components/file2.test.tsx (146 MB heap size)
 PASS  __tests__/components/file3.test.tsx (146 MB heap size)
 PASS  __tests__/components/file4.test.tsx (153 MB heap size)
 PASS  __tests__/components/Header /file5.test.tsx (149 MB heap size)
 PASS  __tests__/pages/file6.test.tsx (149 MB heap size)
 PASS  __tests__/pages/file7.test.tsx (149 MB heap size)
 PASS  __tests__/components/file8.test.tsx (147 MB heap size)
 PASS  __tests__/components/file9.test.tsx (148 MB heap size)
 PASS  __tests__/pages/file10.test.tsx (148 MB heap size)
 PASS  __tests__/components/Header /file11.test.tsx (148 MB heap size)
 PASS  __tests__/functions/file12.test.tsx (149 MB heap size)
 PASS  __tests__/components/file13.test.tsx (148 MB heap size)
 PASS  __tests__/components/file14.test.tsx (150 MB heap size)
 PASS  __tests__/components/file15.test.tsx (150 MB heap size)
 PASS  __tests__/components/Header /file16.test.tsx (149 MB heap size)
 PASS  __tests__/components/file17.test.tsx (149 MB heap size)
 PASS  __tests__/utils/file18.test.tsx (150 MB heap size)
 PASS  __tests__/components/file19.test.tsx (149 MB heap size)
 PASS  __tests__/pages/file20.test.tsx (150 MB heap size)
As you can see, the memory consumption is much more consistent.
You can read more about this issue and the solution in this Github issue, which describes a leaky garbage collector issue with jest.
You can use jest -w 1 to avoid these memory issues.
More information on Jest CLI documentation
--maxWorkers=|# Alias: -w. Specifies the maximum number of workers the worker-pool will spawn for running tests. In single run mode, this defaults to the number of the cores available on your machine minus one for the main thread. In watch mode, this defaults to half of the available cores on your machine to ensure Jest is unobtrusive and does not grind your machine to a halt. It may be useful to adjust this in resource-limited environments like CIs but the defaults should be adequate for most use-cases.
David Miller brings 15 years of experience in global economics, personal finance strategy, and market dynamics. He specializes in turning complex economic trends into actionable insights for everyday readers.
