
Plot Coefficients Depending on Their Significance

I Try to Visualize the Significance of Each Variable/Combination of a Did Model. Attach(Mtcars) M=Lm(Mpg ~ Hp + Wt * Gear, Data =Mtcars) Summary(M) Coef(M)...
I try to visualize the significance of each variable/combination of a DiD model.
attach(mtcars)
M=lm(mpg ~ hp + wt * gear , data =mtcars)
summary(M)

coef(M)
confint(M, level = 0.9)
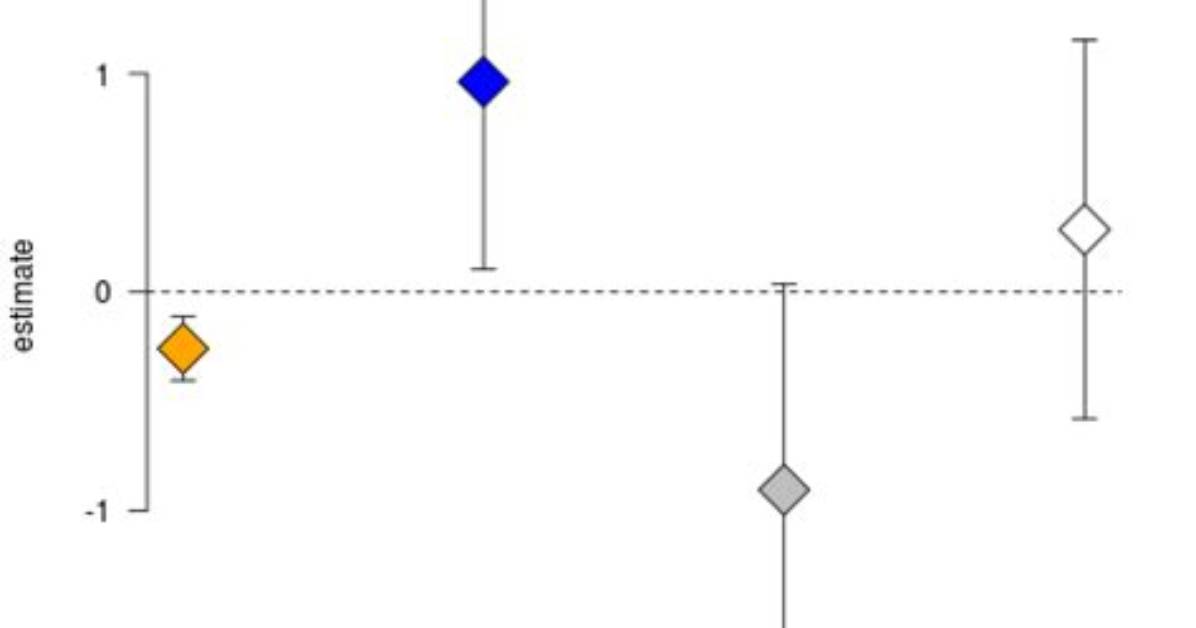
Therefore I want to create a barplot to list the (most) significant coefficients in a sorted order. The summary(M) command lists the coefficients and the corresponding significance codes. Each coefficient with a high significance code (***) should be listend first, then the ** and then the *. The dot and '' should not be included.
So, first of all, how could I get the corresponding significance codes/values of each coefficient. And how can I include/exclude the coefficients depending on the significance?
1 Answer
Before I answer this question, I want to question part of its premise. I would argue that it's best not to dichotomize (trichotomize) effects based on whether they fall on one side or the other of a conventional threshold -- if you really need to do this, I would suggest colouring (as shown below). Please, please, please don't suppose that the difference between 'significant' and 'not significant' is statistically significant ...
## never attach if you can help it! attach(mtcars)
M <- lm(mpg ~ hp + wt * gear , data=mtcars)
coef(summary(M)) pulls out the coefficient table, which is what we want to work with. We will also rearrange it for convenience:
efftab <- function(model) {
     ss <- coef(summary(model))
     ss <- data.frame(var=rownames(ss),ss,
          stringsAsFactors=FALSE)  ## add variable names
     rownames(ss) <- NULL ## cosmetic
     ss <-  ss[-1,]  ## generally makes sense to drop the intercept
     names(ss)[5] <- "pval"    ## rename
     ## p-value categories
     ss$pval_cat <- cut(ss$pval,c(0,0.001,0.01,0.05,0.1,1),
                labels=c("***","**","*",".","_"))
     ss <- ss[order(ss$pval),]  ## order by p-value
     ss
}
Try it out:
print(ss <- efftab(M),digits=3)
##       var Estimate Std..Error t.value    pval pval_cat
## 2      hp  -0.0335    0.00962  -3.486 0.00169       **
## 4    gear   5.3656    2.44437   2.195 0.03693        *
## 5 wt:gear  -1.4791    0.78439  -1.886 0.07013        .
## 3      wt   1.7814    2.76202   0.645 0.52439        _


library("plotrix")
colvec <- c("red","orange","blue","gray","white")

par(las=1,bty="l")
with(ss,plotCI(1:4,Estimate,1.96*Std..Error,pch=23,cex=3,
       pt.bg=colvec[pval_cat],axes=FALSE,xlab="",ylab="estimate"))
axis(side=2)
axis(side=1,at=1:4,ss$var)
abline(h=0,lty=2)
However, this would make more sense if we standardized the variables (see Schielzeth 2010 Methods in Ecology and Evolution), so that differences in magnitude of coefficients actually represents differences in effect, rather than a confounding between the effect size and the units the variable is measured in:
scdat <- mtcars
vars <- c("mpg","hp","wt","gear")
scdat[vars] <- scale(as.matrix(scdat[vars]),center=FALSE)
M2 <- update(M,data=scdat)
ss2 <- efftab(M2)
with(ss2,plotCI(1:4,Estimate,1.96*Std..Error,pch=23,cex=3,
       pt.bg=colvec[pval_cat],axes=FALSE,xlab="",ylab="estimate"))
axis(side=2)
axis(side=1,at=1:4,ss$var)
abline(h=0,lty=2)
For example,
- the
wt:gearinteraction has about the same effect on mpg asgear(although you do need to be careful comparing interaction terms with main effects -- another potential can of worms), even though p<0.05 forgearand p>0.05 forwt:gear. hphas the smallest effect onmpg(or maybe tied with the not-nearly-significant effect ofwt), even though it has the smallest p-value.
Robert Thorne covers electric vehicle innovations, autonomous driving systems, global mobility trends, and automotive engineering developments.
