
Tradingview Heatmap: the Ultimate Data Visualization Tool

The Tradingview Heatmap Is a Powerful Tool That Visualizes Market Data in an Intuitive Way. Tradingview Offers a Stock, Crypto, and Forex Heatmap, and They Are...
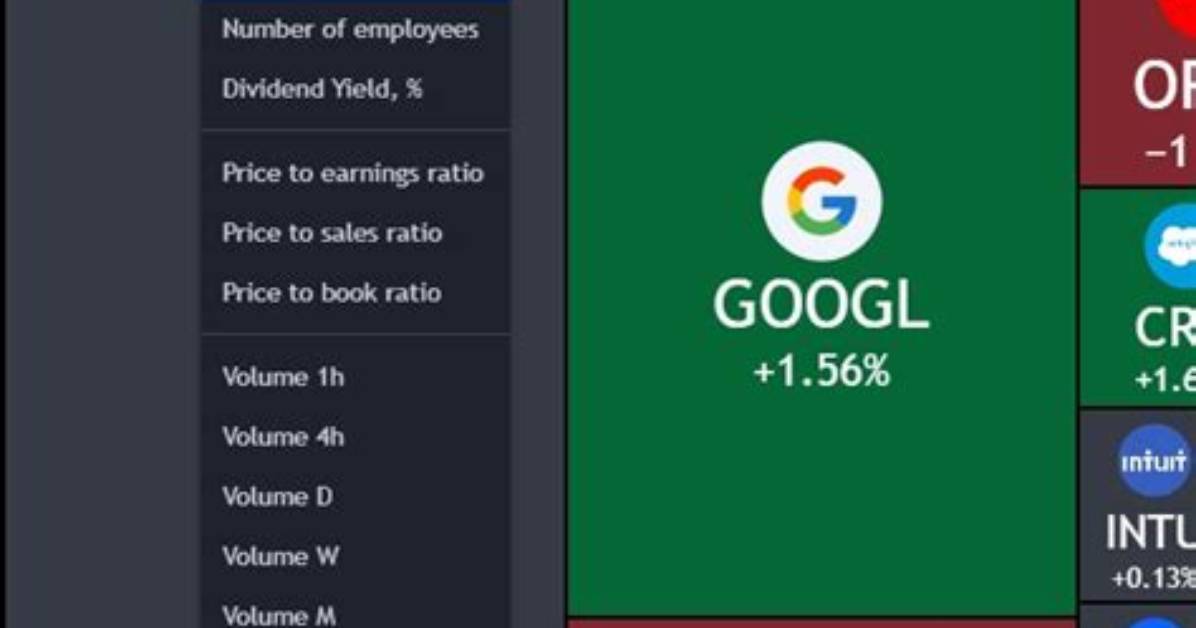
The TradingView heatmap is a powerful tool that visualizes market data in an intuitive way. TradingView offers a stock, crypto, and forex heatmap, and they are some of the best available online.
TradingView Heatmap Introduction
One of the most popular and useful data visualization tools for traders is the TradingView heatmap. The heat map shows the performance of stocks, forex, and cryptocurrencies in real-time using color-coded cells. TradingView’s heatmaps allow you to:
- Compare the performance of different asset classes, sectors, countries, and indicators
- Easily determine which sectors are performing better than others
Must Read
Benefits of the TradingView Heatmap
The TradingView heatmap has many benefits for traders, such as:
- It helps you quickly identify the market sentiment and the direction of the price movements. You can see at a glance which assets are rising or falling, which sectors or countries are outperforming or underperforming, and which indicators are bullish or bearish.
- You can use the heatmap data to assess your exposure to different markets and factors, such as sector risk, country risk, or indicator risk. You can also use the heatmap data to balance your portfolio by adding or removing assets that complement or hedge your existing positions.
Alexander Ross has covered the video game industry for a decade, writing deep dives on game design, esports tournaments, VR developments, and gaming culture.
