
Tradingview Moving Averages: a Comprehensive Guide for Traders

Moving Averages Are Among the Most Popular and Widely-Used Technical Indicators in the World of Trading. These Versatile Tools Help Traders Identify Trends...
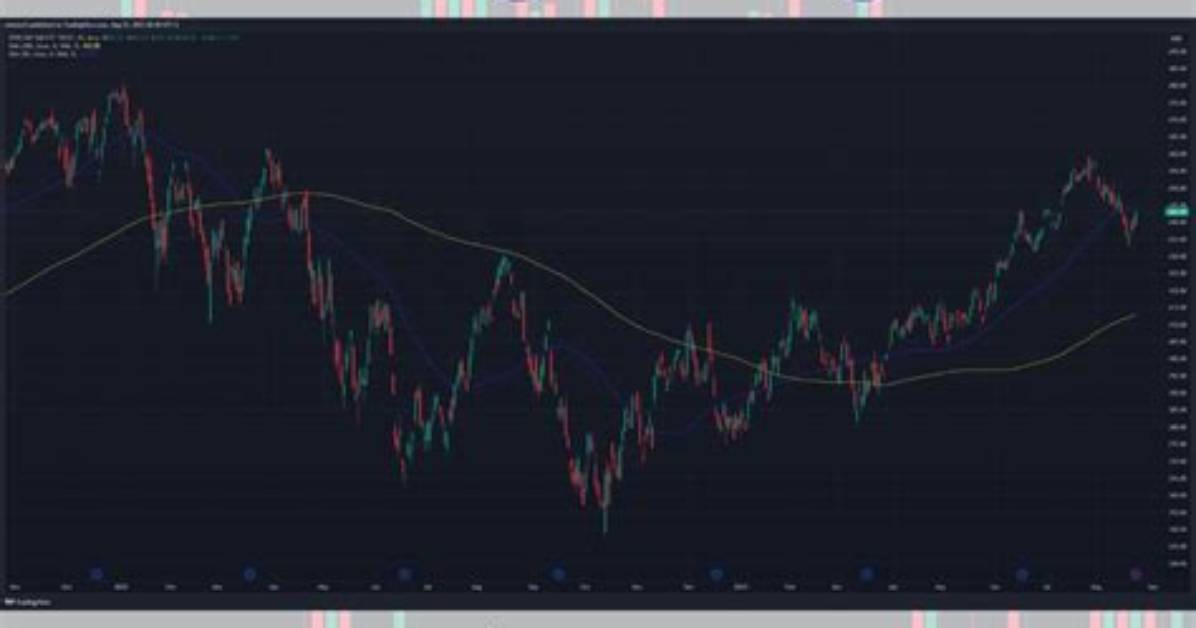
Moving averages are among the most popular and widely-used technical indicators in the world of trading. These versatile tools help traders identify trends, generate signals, and make informed decisions.
In this guide, we’ll explore the fundamentals of moving averages in TradingView, discuss various moving averages, and provide step-by-step instructions on setting them up in your charts.
Understanding Simple and Exponential Moving Averages
Before we dive into the setup process, let’s start with the basics and define two key types of moving averages: Simple Moving Average (SMA) and Exponential Moving Average (EMA).
Simple Moving Average (SMA)
- What is SMA? A Simple Moving Average (SMA) calculates the average price of a financial instrument over a specified period. It’s called “simple” because it gives equal weight to all price data points within the period.
- How is SMA used? SMA is used to identify trends and potential areas of support and resistance. When the price is above the SMA, it indicates a bullish trend; when it’s below, it suggests a bearish trend.
Exponential Moving Average (EMA)
- What is EMA? An Exponential Moving Average (EMA) is similar to SMA but gives more weight to recent price data, making it more responsive to price changes.
- How is EMA used? EMA is commonly used to identify short-term trends and price reversals. It can provide earlier signals compared to SMA due to its sensitivity to recent data.
Differences Between SMA and EMA
- SMA is a straightforward average that treats all data points equally, while EMA prioritizes recent data and reacts faster to price changes.
- SMA provides a smoother line that may be useful for identifying long-term trends, while EMA is more suitable for capturing short-term price movements.
Must Read
Setting Up Moving Averages in TradingView
Now that we’ve covered the basics, let’s explore how to set up moving averages in TradingView.
Step-by-Step Guide
- Open a chart in TradingView and select the financial instrument you want to analyze.
- Click on the “Indicators” button at the top of the chart.
- Search for “Moving Average” in the search bar, and you’ll see various moving average options.
- Choose the desired moving average type (e.g., “Simple Moving Average” for SMA or “Moving Average Exponential” for EMA).
- Customize the settings, such as the period and color, by clicking the gear icon next to the indicator.
- Repeat the process to add multiple moving averages to your chart if desired.
- If the indicator comes with too many lines by default, you can remove them by clicking on the settings icon on the chart and unchecking them in style.
Tips for Using Multiple Moving Averages
- Consider using moving average crossovers as trading signals. For example, when a short-term EMA crosses above a long-term EMA (9 and 26 periods, for example), it may signal a bullish trend.
- Experiment with moving average ribbons, which consist of multiple moving averages plotted together to analyze the strength and direction of a trend.
- Join the HaiKhuu Trading Community to accelerate your learning curve on the stock market.
James Sterling reports on renewable energy developments, climate policy, ecological conservation, and green tech innovations around the globe.
