
Value Stream Mapping (Vsm) Tutorial with Examples & Tips

It Is Often Said That a Picture Is Worth a Thousand Words. the Human Brain Processes Images 60,000 Times Faster Than Text, and 90% of Information Transmitted...
It is often said that a picture is worth a thousand words. The human brain processes images 60,000 times faster than text, and 90% of information transmitted to the brain is visual. Thus, humans respond to and process visual data better than any other type of data.
And when it comes to operational activities—like what you do at work, day in, day out—visualizing what exactly is going on has become a key capability.
Value stream mapping (VSM) is fast becoming one useful technique for visualizing delivery of products and services in order to identify opportunities for improvement. Let’s take a look.
What is VSM?
The ITIL® 4 Foundation publication defines a value stream as a series of steps an organization undertakes to create and deliver products and services to consumers.
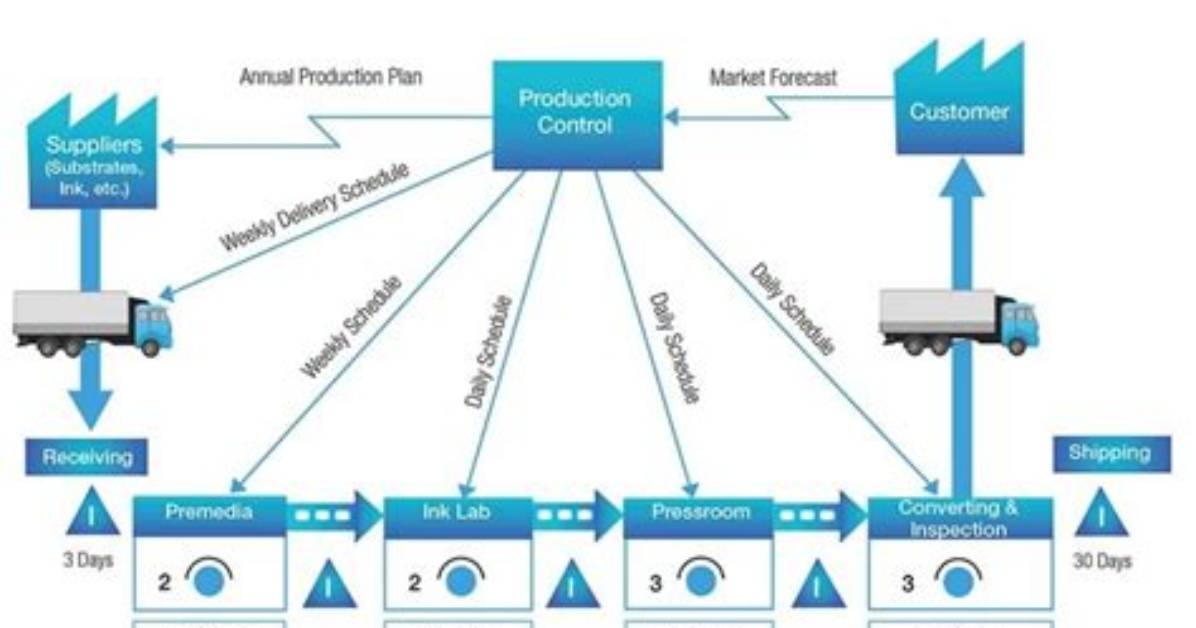
Value stream maps are also one of the tools from Lean manufacturing. VSM visualizes the flow of a single product or service from supplier to customer, with the aim of identifying delays and processes that don’t add value.
The core principle of Lean manufacturing is the elimination of waste—any activity that does not add value from the customer’s perspective—in essence making the organization ‘lean’. The value stream map provides a basis for identifying unnecessary work (‘Muda’), particularly with regard to:
- Time
- Materials
- Processing activities
Lean thinking begins with one simple aspect: identifying value. This is the core objective of Lean management. But, without a clear picture of how you deliver value today, you can’t improve your value-creation process.
VSM provides that clarity for us by charting the flow of work through the different steps involved in the development/delivery of a product or service.
- Flow is ‘good’ when work moves steadily and predictably in relation to customer demand and supplier capacity.
- Flow is ‘bad’ when work starts and stops erratically and frequently.
By visualizing flow, VSM helps organizations move from bad to good through improvements in productivity and reduction in waste—leading to value creation for both you, as the supplier, and your customers.
(Learn about other mapping visualization approaches, like Wardley Value Chain Mapping, BPMN, and Business Capability Mapping, to improve company processes.)
Must Read
Who uses VSM?
While VSM origins are in the manufacturing sector, the concepts apply to any product or service delivery framework, including:
- Logistics
- Software development
- Healthcare
- Government services
Chloe Bennett explores the intersection of pop culture, streaming entertainment, digital trends, and contemporary lifestyle. Her weekly commentary reaches thousands of culture enthusiasts.
