
Probability and Statistics Symbols, What Is the Probability Symbol, Examples

Probability and Statistics Symbols a Set of Symbols and Notations That Are Used to Represent Mathematical Concepts and Operations in the Field of Probability...
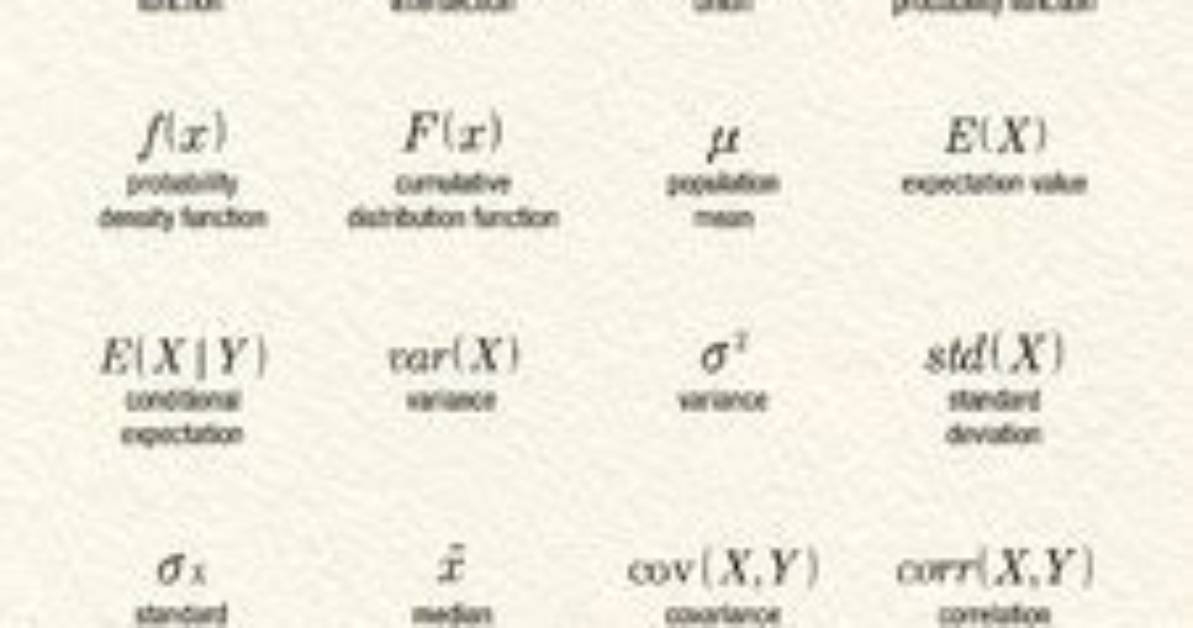
Probability And Statistics Symbols A set of symbols and notations that are used to represent mathematical concepts and operations in the field of probability and statistics is known as Statistics And Probability Symbols.
Probability And Statistics Symbols
Probability and Statistics Symbols are mathematical symbols and notation used to represent concepts and quantities in probability and statistics. These symbols allow for concise and precise communication of mathematical ideas and results. Some common symbols used in probability and statistics include:
- π (pi) - represents the probability of an event happening (0 <= π <= 1).
- P(A) - represents the probability of event A happening.
- P(A|B) - represents the conditional probability of event A happening given that event B has already happened.
- ∩ - represents the intersection of two events, i.e. the occurrence of both events at the same time.
- ∪ - represents the union of two events, i.e. the occurrence of either event or both events.
- E(X) - represents the expected value (mean) of a random variable X.
- μ - represents the population mean.
- x̄ - represents the sample mean.
- σ - represents the population standard deviation.
- s - represents the sample standard deviation.
- ∑ - represents summation, used to add up the values of a set of numbers.
- N - represents the number of elements in a set.
- df - represents the degrees of freedom in a statistical analysis.
- t - represents the t-statistic in a t-test.
- p-value - represents the probability of observing a test statistic as extreme or more extreme than the one observed, assuming the null hypothesis is true.
These are just a few of the most commonly used symbols in probability and statistics. There are many others, depending on the context and the specific statistical method being used.
Probability and Statistics are branches of mathematics that deal with the study of random events and the collection, analysis, interpretation, presentation, and organisation of data. Probability deals with the likelihood or chance of an event happening, while Statistics deals with the use of data to make inferences and decisions.
In Probability and Statistics, symbols and notation are used to represent mathematical concepts and quantities. These symbols allow for a concise and precise way of communicating mathematical ideas and results. For example, the symbol "π" is used to represent the probability of an event happening, with values between 0 and 1. The symbol "μ" represents the population mean, which is the average value of a set of data. The symbol "s" represents the sample standard deviation, which measures the spread of a set of sample data.
In summary, Probability and Statistics Symbols are an important part of the language used to communicate mathematical ideas and results in these fields.
Examples of Probability And Statistics Symbols
Here are a few examples of how symbols and notation are used in probability and statistics:
- The probability of rolling a 6 on a fair six-sided die can be represented as: P(rolling a 6) = 1/6
- The conditional probability of event A happening given that event B has already happened can be represented as: P(A | B), where the vertical bar represents "given". For example, the probability of rolling a 6 on a fair six-sided die given that an even number was rolled can be represented as: P(rolling a 6 | rolling an even number) = 1/3
- The expected value (mean) of a random variable X can be represented as: E(X), which represents the average outcome of many trials of a random event. For example, the expected value of the number of heads in 10 coin flips can be represented as: E(number of heads in 10 coin flips) = 5
- The population mean can be represented as: μ. For example, the population mean height of adult males in a certain population can be represented as: μ = 68 inches
- The sample mean can be represented as: x̄. For example, the sample mean height of 10 randomly selected adult males can be represented as: x̄ = 67 inches
- The sample standard deviation can be represented as: s. For example, the sample standard deviation of the height of 10 randomly selected adult males can be represented as: s = 1.5 inches
- The p-value is used in hypothesis testing to represent the probability of observing a test statistic as extreme or more extreme than the one observed, assuming the null hypothesis is true. The p-value can be represented as: p-value. For example, the p-value for a t-test comparing the means of two groups can be represented as: p-value = 0.05, which means there is a 5% chance of observing the test statistic or a more extreme value, assuming the null hypothesis is true.
These are just a few examples of how symbols and notation are used in probability and statistics. There are many others, depending on the context and the specific statistical method being used.
Here are some strategies you can use to find Probability and Statistics symbols:
- Use a textbook or online resource: Most introductory probability and statistics textbooks will have a list of symbols and notation used in the field. Online resources such as Wikipedia or Khan Academy also have comprehensive lists and definitions of commonly used symbols and notation.
- Search for symbols using a search engine: If you need to look up the meaning of a specific symbol, you can use a search engine such as Google to search for "Probability and Statistics symbols [symbol name or notation]"
- Use a cheat sheet or reference card: There are many online cheat sheets and reference cards that you can use to quickly find the meaning of a specific symbol or notation. Some of these resources are specifically designed for probability and statistics, while others cover a broader range of mathematical symbols.
- Ask a teacher or mentor: If you are taking a course in probability and statistics, your teacher or mentor can be a great resource for finding the meaning of a specific symbol or notation.
By using these strategies, you should be able to find the meaning of any Probability and Statistics symbol or notation you need to know.
List Of Probability And Statistics Symbols
Here is a list of commonly used symbols and notation in Probability and Statistics:
- P(A) - Probability of event A happening
- P(A|B) - Conditional probability of event A happening given that event B has already happened
- E(X) - Expected value (mean) of a random variable X
- μ - Population mean
- x̄ - Sample mean
- s - Sample standard deviation
- σ - Population standard deviation
- n - Sample size
- ∑ - Summation symbol, used to represent the sum of a series of terms
- Ω - Sample space, representing all possible outcomes of a random event
- ∩ - Intersection symbol, used to represent the overlap of two or more events
- ∪ - Union symbol, used to represent the combination of two or more events
- ( ) - Parentheses, used to group terms in mathematical expressions
- - Brackets, used to represent the interval of values for a random variable
- p - Proportion, representing the number of times an event occurs divided by the number of trials
- q - Complement of the proportion p, representing the number of times an event does not occur divided by the number of trials
- χ2 - Chi-squared statistic, used in hypothesis testing to determine if an observed distribution is significantly different from a theoretical distribution
- t - Student's t-statistic, used in hypothesis testing to compare the means of two groups
- Z - Standard normal score, representing the number of standard deviations away from the mean of a standard normal distribution
- F - F-statistic, used in hypothesis testing to compare the variances of two groups.
Note that this list is not exhaustive and there may be other symbols and notation used in different areas of Probability and Statistics. Additionally, some symbols may have different meanings in different contexts, so it is important to consult a reference when in doubt.
Here are some details for selected symbols and notation commonly used in Probability and Statistics:
- P(A) - Probability of event A happening: This symbol represents the likelihood or chance of an event A occurring. Probabilities are expressed as a number between 0 and 1, with 0 meaning an impossible event and 1 meaning a certain event. For example, if the probability of rolling a 6 on a fair die is 1/6, we write P(rolling a 6) = 1/6.
- P(A|B) - Conditional probability of event A happening given that event B has already happened: This symbol represents the probability of event A happening, given that event B has already happened. For example, if the probability of a coin landing heads is 1/2, and the probability of a coin landing heads given that it landed tails on the previous flip is also 1/2, we write P(heads|tails) = 1/2.
- E(X) - Expected value (mean) of a random variable X: This symbol represents the expected or average value of a random variable X. The expected value is calculated by multiplying each outcome of the random variable by its probability, and then summing these products. For example, if X is a random variable representing the number of heads in two flips of a fair coin, the expected value of X is E(X) = 2 * (1/2) = 1.
- μ - Population mean: This symbol represents the average value of a population, calculated as the sum of all the values in the population divided by the total number of values. The population mean is often estimated using a sample mean, represented by x̄.
- s - Sample standard deviation: This symbol represents the measure of variability or spread of a sample of data. The sample standard deviation is calculated as the square root of the sample variance, which is the average of the squared differences between each data point and the sample mean.
- σ - Population standard deviation: This symbol represents the measure of variability or spread of a population. The population standard deviation is calculated as the square root of the population variance, which is the average of the squared differences between each data point and the population mean.
- n - Sample size: This symbol represents the number of data points in a sample. The sample size is an important factor in many statistical calculations, as it affects the precision and accuracy of statistical estimates.
- ∑ - Summation symbol: This symbol is used to represent the sum of a series of terms. For example, if X is a random variable representing the number of heads in two flips of a fair coin, the expected value of X can be represented as ∑(X * P(X)), where the summation is over all possible values of X.
- Ω - Sample space: This symbol represents the set of all possible outcomes of a random event. The sample space defines the set of values that a random variable can take, and is an important concept in probability theory.
- ∩ - Intersection symbol: This symbol is used to represent the overlap of two or more events. For example, if A and B are two events, the intersection of A and B represents the set of outcomes that are in both A and B.
- ∪ - Union symbol: This symbol is used to represent the combination of two or more events. For example, if A and B are two events, the union of A and B represents the set of outcomes that are in either A or B (or both).
- χ2 - Chi-squared statistic:
James Sterling reports on renewable energy developments, climate policy, ecological conservation, and green tech innovations around the globe.
